

In this article, we will look at debugger configuration and learn how to use its features to analyze the operation of the microcontroller. We will cover the Registers tab, which displays the general-purpose registers of the Cortex-M4 core, the SFRs tab containing peripheral registers (such as USART, GPIO, TIM), as well as Live Expressions, which allows monitoring variable values in real time.
This approach helps to understand exactly how the program is executed and how the registers change during its operation.
Initial Debugger Setup.
On the toolbar, click the arrow next to the bug icon.
![]()
Select Run Configuration, then click on STM32 C/C++ Application and the line beneath it.

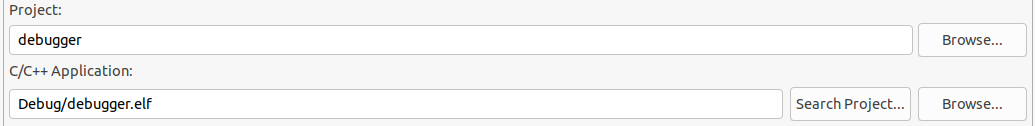
In the Main tab, select the project name. There is also an option to edit environment settings and other parameters via Configure Workspace Settings, but we will leave these unchanged for now.
Next, go to the Debugger tab. Here, Autostart local GDB server is selected.
GDB is the standard GNU debugger (GNU Debugger), which allows you to control the code, set breakpoints, step through execution, and inspect memory and variables.
The next component in the debugging chain is ST-LINK, a hardware debugger and programmer from STMicroelectronics for STM32 microcontrollers. On the STM32F4 Discovery board, it is implemented with the STM32F103 microcontroller. This chip runs special firmware and is used to program and debug the main microcontroller. Without it, an external debugger would be required. (It can also be used to program other microcontrollers, not just the one on the board.)
ST-LINK communicates via SWD or JTAG interfaces. SWD is the newer interface with only two connections to the microcontroller, which makes it more commonly used.
This gives the following setup diagram:
CubeIDE (GDB client)
⇓debug commands (break, step, read var)
GDB Server (st-link_gdbserver)
⇓ low-level commands (via USB)
ST-LINK (hardware/firmware)
⇓SWD / JTAG signals
STM32 microcontroller
Next, select the interface and search for the debugger by clicking the Scan button.
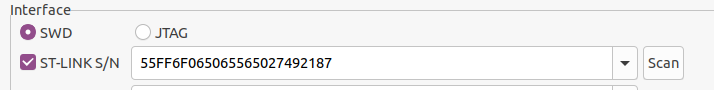
At the bottom of the Debugger tab, there is an option to select Shared ST-LINK. Enable this if you are using, for example, STM32Cube Monitor alongside your debugger.
In the Main tab of the debugger, select the location of your project.
With these steps, the minimal setup is complete. Now click the Debug button to enter the debugger.
Variable Debugging.
When we enter the debugger, a window appears on the right side showing variable values that can be monitored.
For example, let’s create a variable:
/* USER CODE BEGIN PV */
uint32_t counter = 0; /*
USER CODE END PV */
and we will increment its value by 1 every second.
while (1)
{
    counter++;
    HAL_Delay(1000);
}
The while loop runs after all initializations. Place a breakpoint on the line with HAL_Delay and observe that the variable increments by 1 each cycle. In debug mode, HAL_Delay does not actually wait for the specified time.
If you declared a global variable, it might not appear in the window on the right. It is easier to add it to watch expressions to monitor its current value. To do this, right-click the variable and select Add Watch Expression.
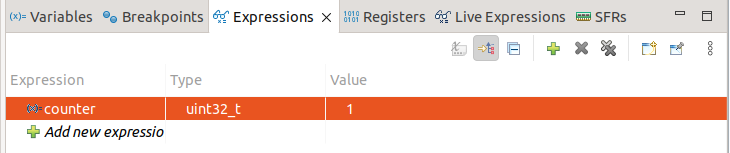
Unlike regular breakpoints and variable watches, Live Expressions allows you to update data “on the fly,” almost without interfering with the code execution. You can add not only individual variables but also entire expressions.
Debugging General-Purpose Registers.
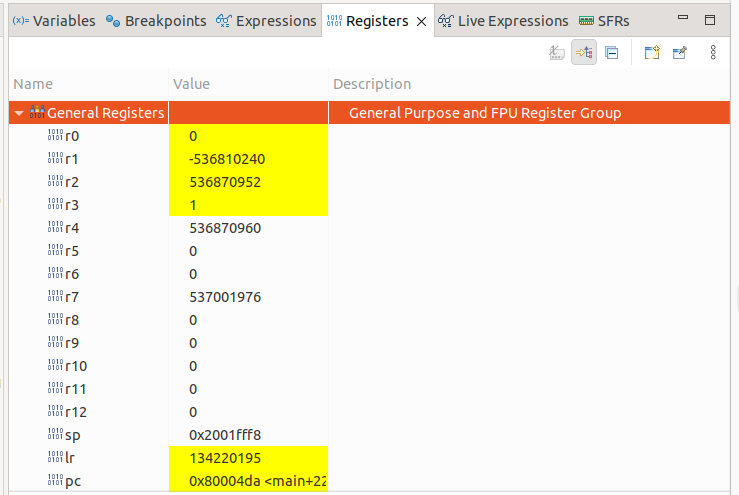
In the Registers tab, you can find the general-purpose registers — the General Purpose and FPU Register Group of the ARM Cortex-M4 core. They are not directly related to the STM32 peripherals. The registers include:
- R0–R12 – general-purpose registers used to store variables, addresses, and temporary values during execution.
- SP (Stack Pointer) – points to the current top of the stack.
- LR (Link Register) – stores the return address from a function.
- PC (Program Counter) – indicates which instruction is currently being executed.
- xPSR (Program Status Register) – contains processor flags (Zero, Negative, Carry, Overflow) and mode information.
FPU registers (S0–S31) – used for floating-point operations (float/double), plus the FPSCR register for FPU status.
Special-Purpose Registers.
They are located in the SFRs tab and are divided into two groups: Cortex-M4 and STM32F407 (each microcontroller has its own set).
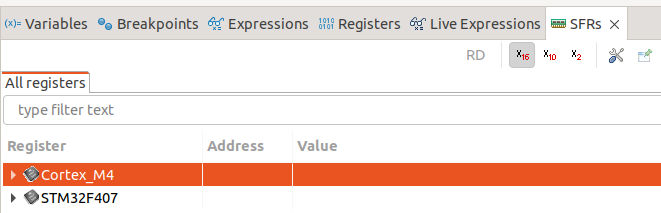
Cortex-M4 is the ARM core, common to all STM32F4 microcontrollers.
It contains the system registers of the core, which are defined by ARM:
- NVIC – Nested Vectored Interrupt Controller (interrupt management)
- SysTick – system timer (used by HAL_Delay())
- SCB – System Control Block (exception information, stack configuration, etc.)
- MPU – Memory Protection Unit (if available)
- DWT/ITM – debug blocks
In other words, these are the “internal workings of the processor” and are the same for all STM32 devices with a Cortex-M4 core.
STM32F407 refers to the peripherals of this specific microcontroller, including:
- GPIO (ports A, B, C, D…)
- RCC (clock control)
- USART, SPI, I2C
- TIMx (timers)
- ADC, DAC
- DMA
- and others
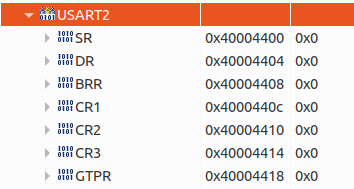
When selecting any peripheral, we can see its address, name, and a list of registers. For example, USART2.
Example with UART.
Let’s take data transmission via UART as an example. Data will be sent from UART2 to UART3. All settings can be found in this article( https://beartronix.com/uart )
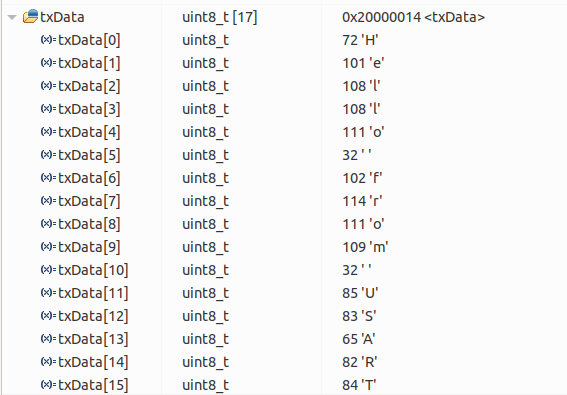
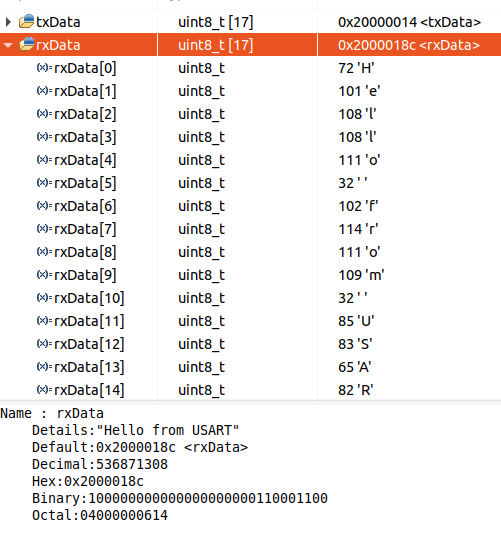
First, let’s create the transmit and receive buffers and monitor their status during step-by-step debugging.
uint8_t txData[] = "Hello from USART"; // <span style="font-weight: 400;" data-mce-style="font-weight: 400;">transmit buffer</span>
uint8_t rxData[sizeof(txData)]; // <span style="font-weight: 400;" data-mce-style="font-weight: 400;">receive buffer</span>
Transmission and reception will be performed using the following lines:
HAL_UART_Receive_IT(&amp;amp;huart3, rxData, sizeof(txData) - 1); HAL_UART_Transmit_IT(&amp;amp;huart2, txData, sizeof(txData) - 1);
Add our arrays to Expressions by right-clicking them and selecting Add Watch Expression.
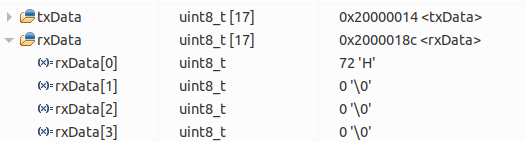
Expand them to view their contents. The transmit array contains our data.
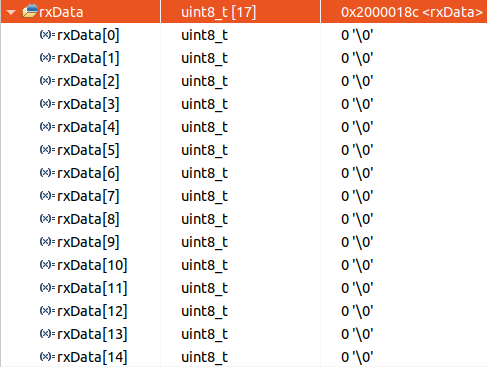
The receive array is still empty.
Place a breakpoint after the receive and transmit functions. Press F8. The program will run until it reaches the breakpoint.
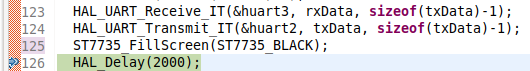
And our array is being filled with values.
Now, place a breakpoint on the receive line, reach it using Resume (F8), and step through to see what happens.
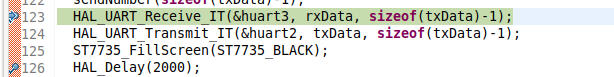
The program stops at line 123 in the receive function. Press F5 and you will see that the program enters the UART receive function. If you continue step by step, you can observe the transmission and reception process. Press F8, and you will notice that the receive register contains only the character “H”. This happens because the interrupt has not yet occurred.
Registers Tab.
Let’s step through and monitor the changes in the PC and LR registers.
- PC (Program Counter) – This is the instruction counter (points to the current instruction). It always points to the memory address of the next instruction to execute. In the debugger, you can see where the CPU is currently executing. If the program “hangs,” the PC shows the address, helping you identify the location (for example, in an infinite loop or exception handler).
- LR (Link Register) – In the debugger, LR helps determine where execution will return after a function call. If LR is corrupted (e.g., memory is damaged), the program may jump to an invalid address and trigger a HardFault.
In debug mode, we enter the HAL_Init() function. Press F5 and observe that the PC register changes, for example:
0x80013A4 <HAL_Init+16>
- 0x080013A4 is the physical flash address in the STM32 where the execution currently is.
- <HAL_Init+16> indicates that the PC is inside the HAL_Init function, but not at the start. +16 is the byte offset from the beginning of the function.
The LR register contains 0x8000C4F, which is the address where the program will return after finishing the current function.
SFRs Tab.
Now let’s analyze step by step what happens using the USART2 registers as an example. UART has the following registers:

- SR (Status Register) – status flags (ready to transmit/receive, errors, overflow, etc.).
- DR (Data Register) – data register for sending and receiving a byte.
- BRR (Baud Rate Register) – sets the communication speed (clock divider).
- CR1 (Control Register 1) – main settings: USART enable, interrupts, frame format (data bits, parity, etc.).
- CR2 (Control Register 2) – additional settings: stop bits, synchronous mode (CK), LIN, addressing.
- CR3 (Control Register 3) – advanced options: DMA, flow control (CTS/RTS), error management.
- GTPR (Guard Time and Prescaler Register) – for SmartCard mode (guard time) and IrDA clock prescaler.
We are interested in the initialization function:
MX_USART2_UART_Init();
Run it in debug mode and observe that three registers change their values: SR, BRR, and CR1.
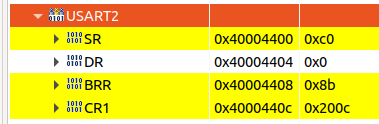
The SR register is set to 0xC0 = 11000000
- Bit 7 TXE = 1 indicates that the transmitter is empty.
- Bit 6 TC = 1 indicates that the transmission is complete.
The BRR register is set to 0x8B, configuring the baud rate to 115200 bits/s (in reality, if calculated using the formulas from the datasheet, the exact speed may differ slightly, but the error is negligible).
The CR1 register is set to 0x200C = 0010 0000 0000 1100, configuring the register bits as follows:
- UE = 1 – enable USART.
- TE = 1 – enable transmission.
- RE = 1 – enable reception.
- M = 0 – word length 8 bits.
- PCE = 0 – parity control disabled.
- All other bits are set to 0.
After that, the actual transmission process begins.
If you enter the HAL_UART_Transmit_IT function in debug mode and step through it, you will see the data being loaded into the DR register of UART3.
![]()
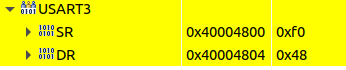
Its value becomes 0x48, which corresponds to the letter “H” from our array “Hello from USART”.
In conclusion, we explored the capabilities of the built-in debugger, which provides convenient access to both program variables and the microcontroller’s hardware registers. This allows real-time monitoring of value changes, tracking peripheral operation, and step-by-step analysis of code execution. Such an approach greatly simplifies debugging and helps to better understand how the software interacts with the hardware.