

SWV is a debugging tool built into STM32 microcontrollers based on the ARM Cortex-M core. It allows real-time diagnostic information to be obtained. Using SWV, a developer can output messages via printf, monitor variable values, analyze peripheral operation, inspect register data, and collect code execution statistics.
All of this is done through a dedicated SWO line connected to the built-in ST-Link debugger, making SWV convenient to use and almost transparent to the main firmware.
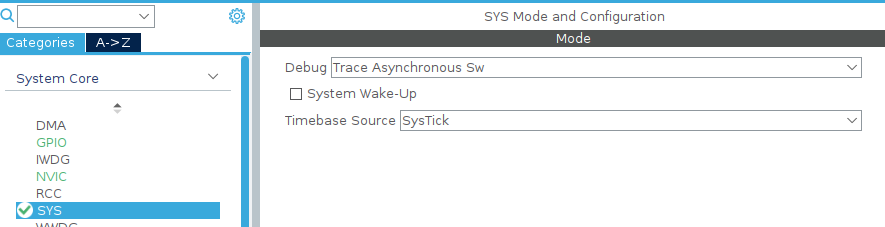
SWV Configuration.
Open the .ioc file and go to SYS → Debug → Trace Asynchronous SW (extended mode, which enables SWV support via the SWO pin, usually PB3 on STM32F4).
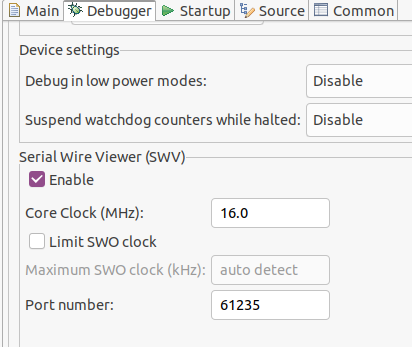
Then go to Debug Configuration, enable SWV – Enable, and select the frequency (it must match the actual core frequency).
Let’s override the _write function.
/* USER CODE BEGIN PFP */
int _write(int file, char *ptr, int len)
{
/* Implement your write code here, this is used by puts and printf for example */
int i = 0;
for (i = 0; i < len; i++)
     ITM_SendChar((*ptr++));
return len;
}
/* USER CODE END PFP */
Overriding the _write() function redirects all standard output (printf, puts) through SWV (ITM). After this, printf() no longer sends data via UART — to output via UART, you need to use direct calls to HAL_UART_Transmit().Compile the code and enter debug mode.
Add the SWV ITM Data Console: on the top panel, click Window → Show View → SWV → SWV ITM Data Console.
Go to this console and click the Configure Trace button.

Enable Port 0.
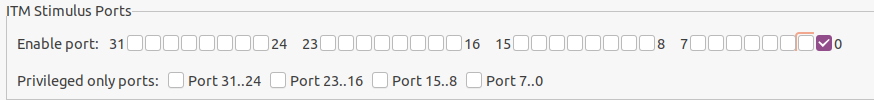
For our case, this is sufficient, but if you want to monitor multiple values simultaneously, it may be convenient to enable several ports.
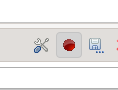
Next, click the Start Trace button on the Data Console panel.
Add a variable for output.
/* USER CODE BEGIN PV */
int count = 0;
/* USER CODE END PV */
And the output itself.
/* USER CODE BEGIN 2 */
printf("Hello from Beartronix\n");
/* USER CODE END 2 */

/* Infinite loop */
/* USER CODE BEGIN WHILE */
while (1)
{
    printf("count= %d\n", count);
    count++;
    HAL_Delay(1000);
/* USER CODE END WHILE */
/* USER CODE BEGIN 3 */
}
/* USER CODE END 3 */
}
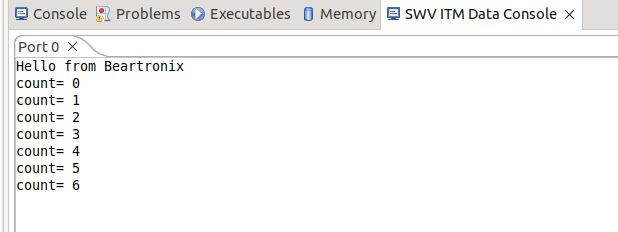
In conclusion, SWO allows you to output debugging information to the console in real time without stopping the program or using UART. This is sufficient to get started. Additionally, there are features like Event Trace and the ability to monitor variable and register changes via DWT, which will be covered in future articles.